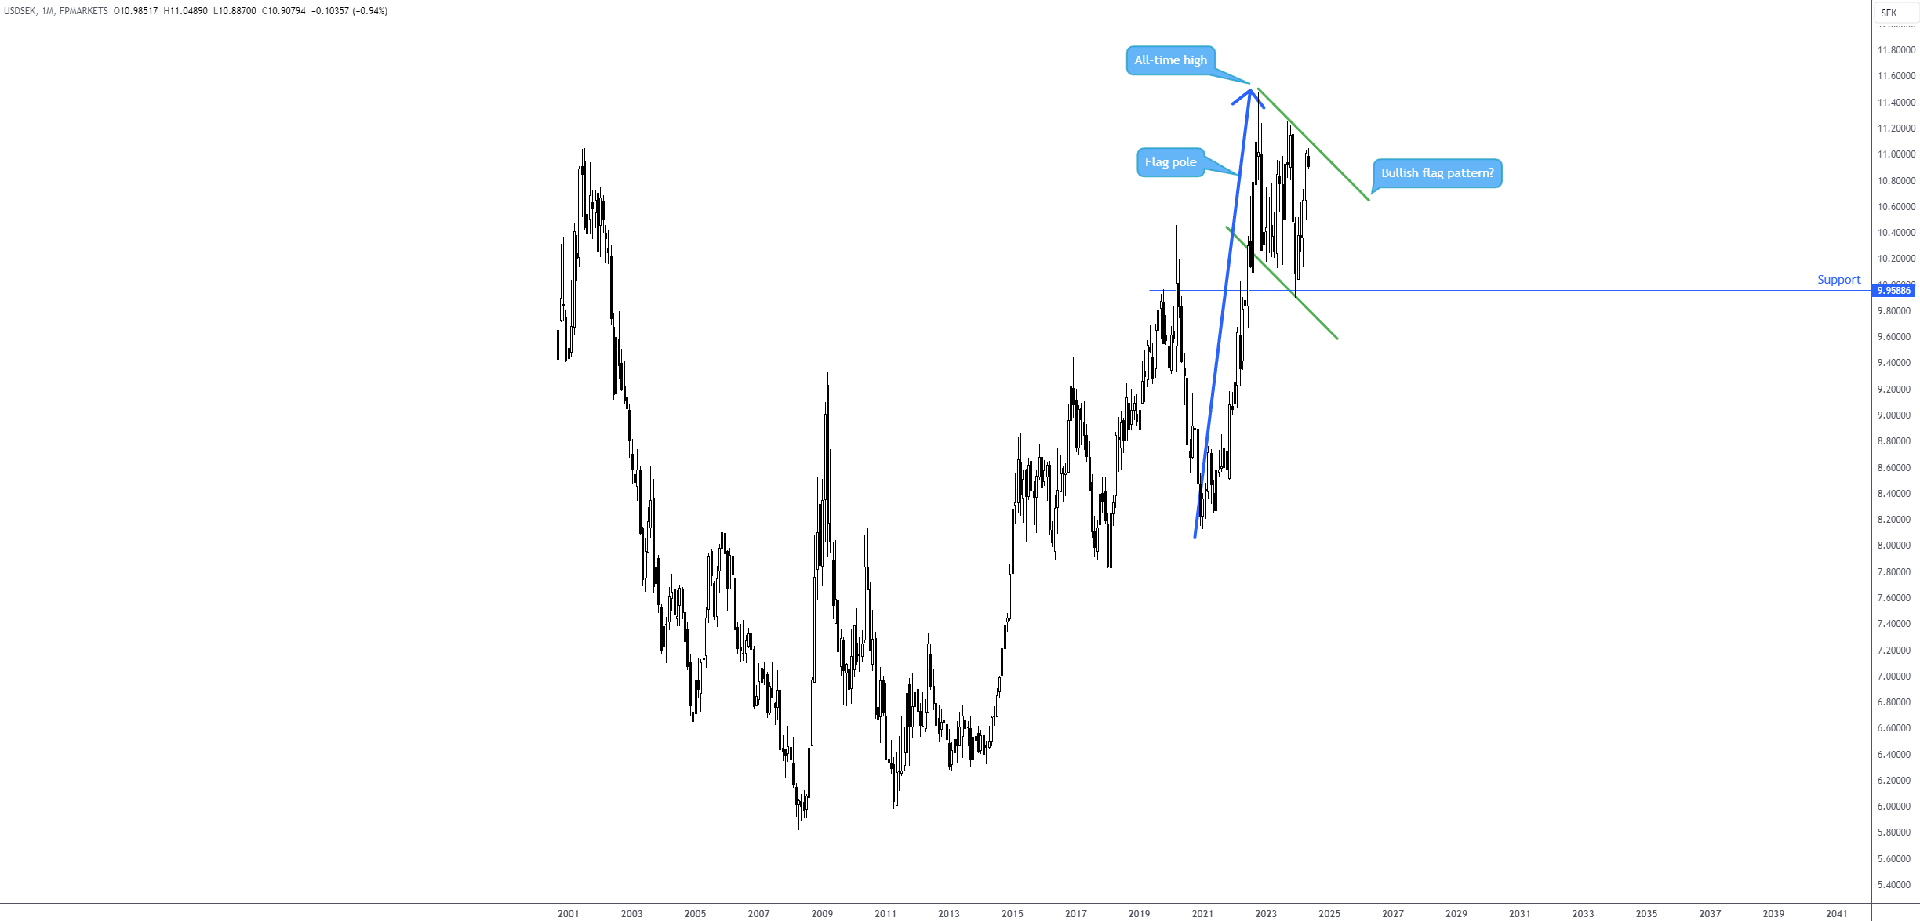
Forex: Long-Term Bullish Flag on USD/SEK
Monthly Timeframe –
Since late 2022, against the Swedish krone (kr), the US dollar (USD) has been busy chalking up a potential bullish flag pattern off all-time highs at kr11.50.
As evident from the monthly timeframe, the longer-term trend favours a breakout to the upside and price action is closing in fast on the upper boundary of the bullish flag pattern. A breakout (close) above the noted structure is likely to prompt traders and investors to seek bullish scenarios, immediately targeting all-time highs and possibly beyond (bullish flag traders tend to arrange profit objectives by taking the distance of the flag pole and simply extending this value from where price breaks the upper limit of the pattern).
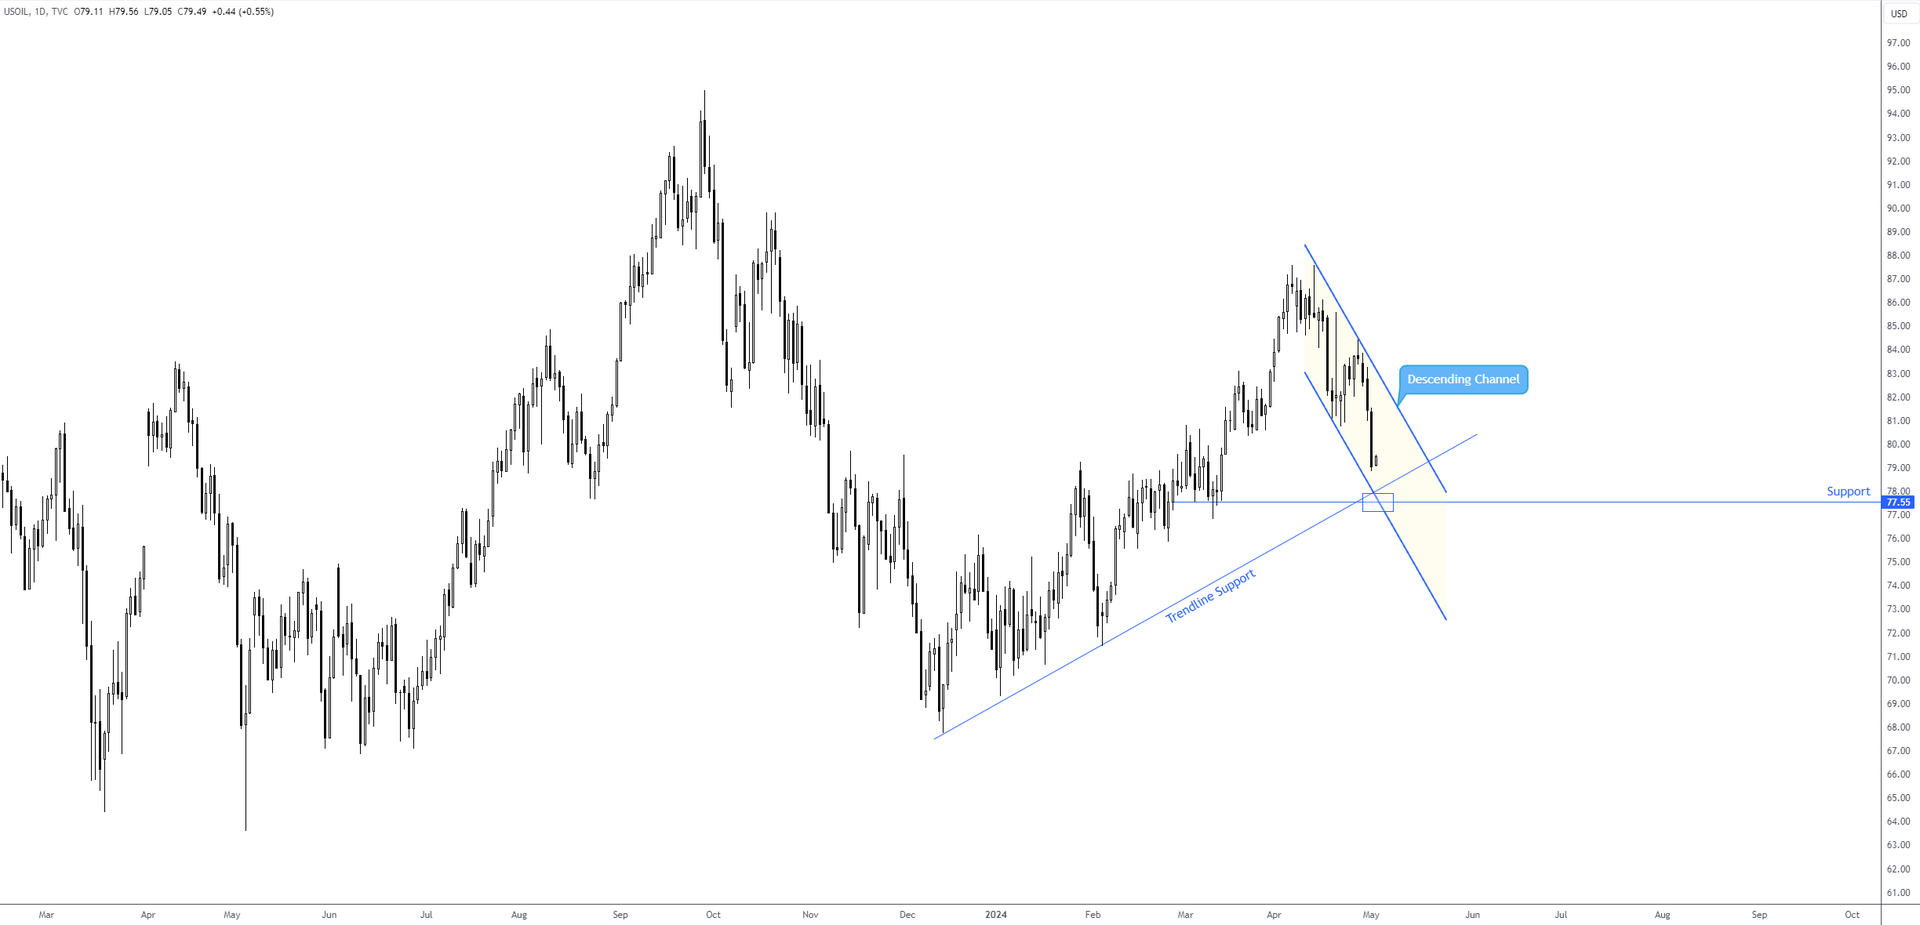
Commodities: WTI Oil Closing in on Trendline Support
Daily Timeframe –
We have a simple chart layout for the WTI oil chart this week to work with. Following four consecutive days of losses, price action is within a stone’s throw of connecting with a tight area of confluence, consisting of Quasimodo support from $77.55, trendline support (drawn from the low of $67.74) and channel support from the low of $81.09.
Should price test the aforementioned area of support, a logical upside objective to take into account would be the opposing channel resistance (extended from the high of $87.60).
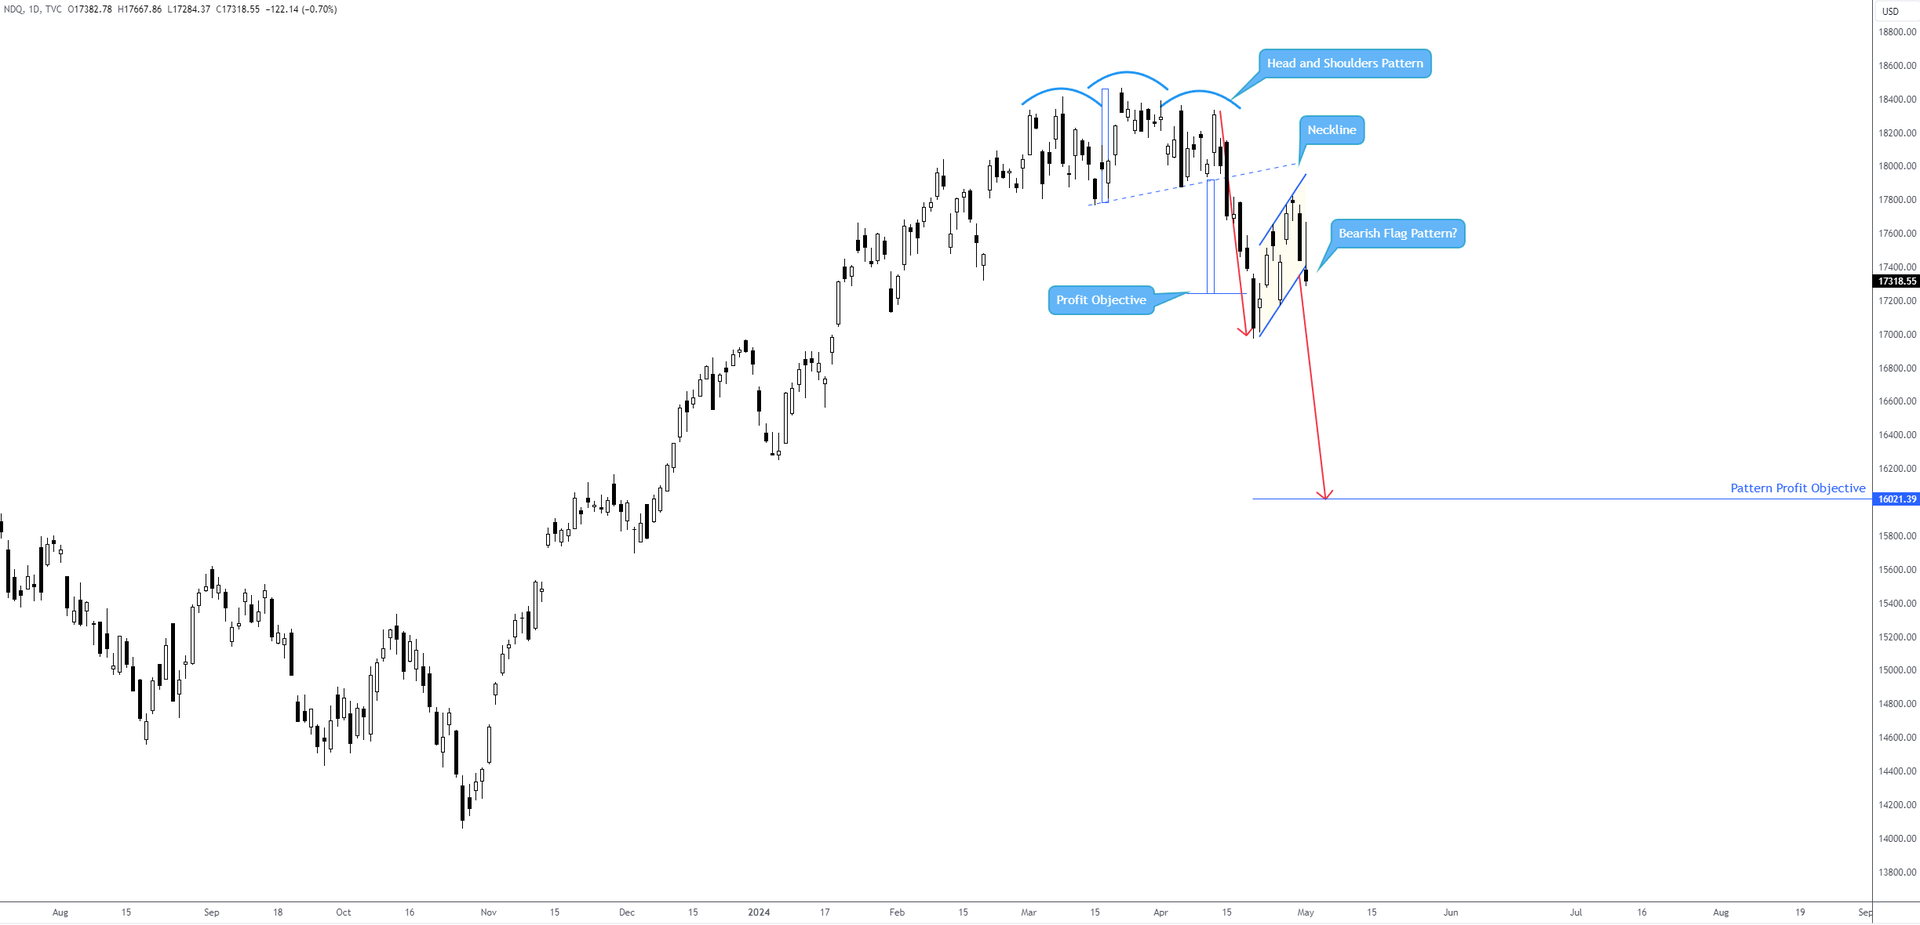
Equities: Dow Pattern Structure Signals Further Selling
Daily Timeframe –
Following the recent completion of a head and shoulders top pattern (established off all-time highs at 18,464) on the Dow that hit its profit objective of 17,243, sellers could remain in control of this market according to yesterday’s bearish flag pattern completion, formed from 17,010 and 17,653.
According to the bearish flag pattern’s rules of engagement, chart pattern traders will be eyeing as far south as 16,021 (derived from taking the flag pattern’s pole distance and extending this from the breakout point).
Cryptocurrency: BTC/USD Testing Major Support
Weekly Timeframe –
We have an interesting scenario brewing for the price of Bitcoin against the US dollar (BTC/USD). As you can see from the weekly timeframe for the major crypto pairing, price action recently welcomed support at $56,796, which happens to be positioned close by a 1.272% Fibonacci projection ratio at $55,649 (an ‘alternate’ AB=CD bullish formation). In the event of a bullish recovery from here, it might be worth pencilling in a Fibonacci retracement from the all-time high to the low formed from support, as AB=CD traders often take aim at the 38.2% and 61.8% Fibonacci retracement ratios.
The concern for bulls at this point is that upside momentum has noticeably slowed according to the Relative Strength Index (RSI), recently crossing south of indicator trendline support, taken from the low of 23.71. If sellers remain at the wheel, the decision point area at $50,619-$53,057 could soon be challenged.